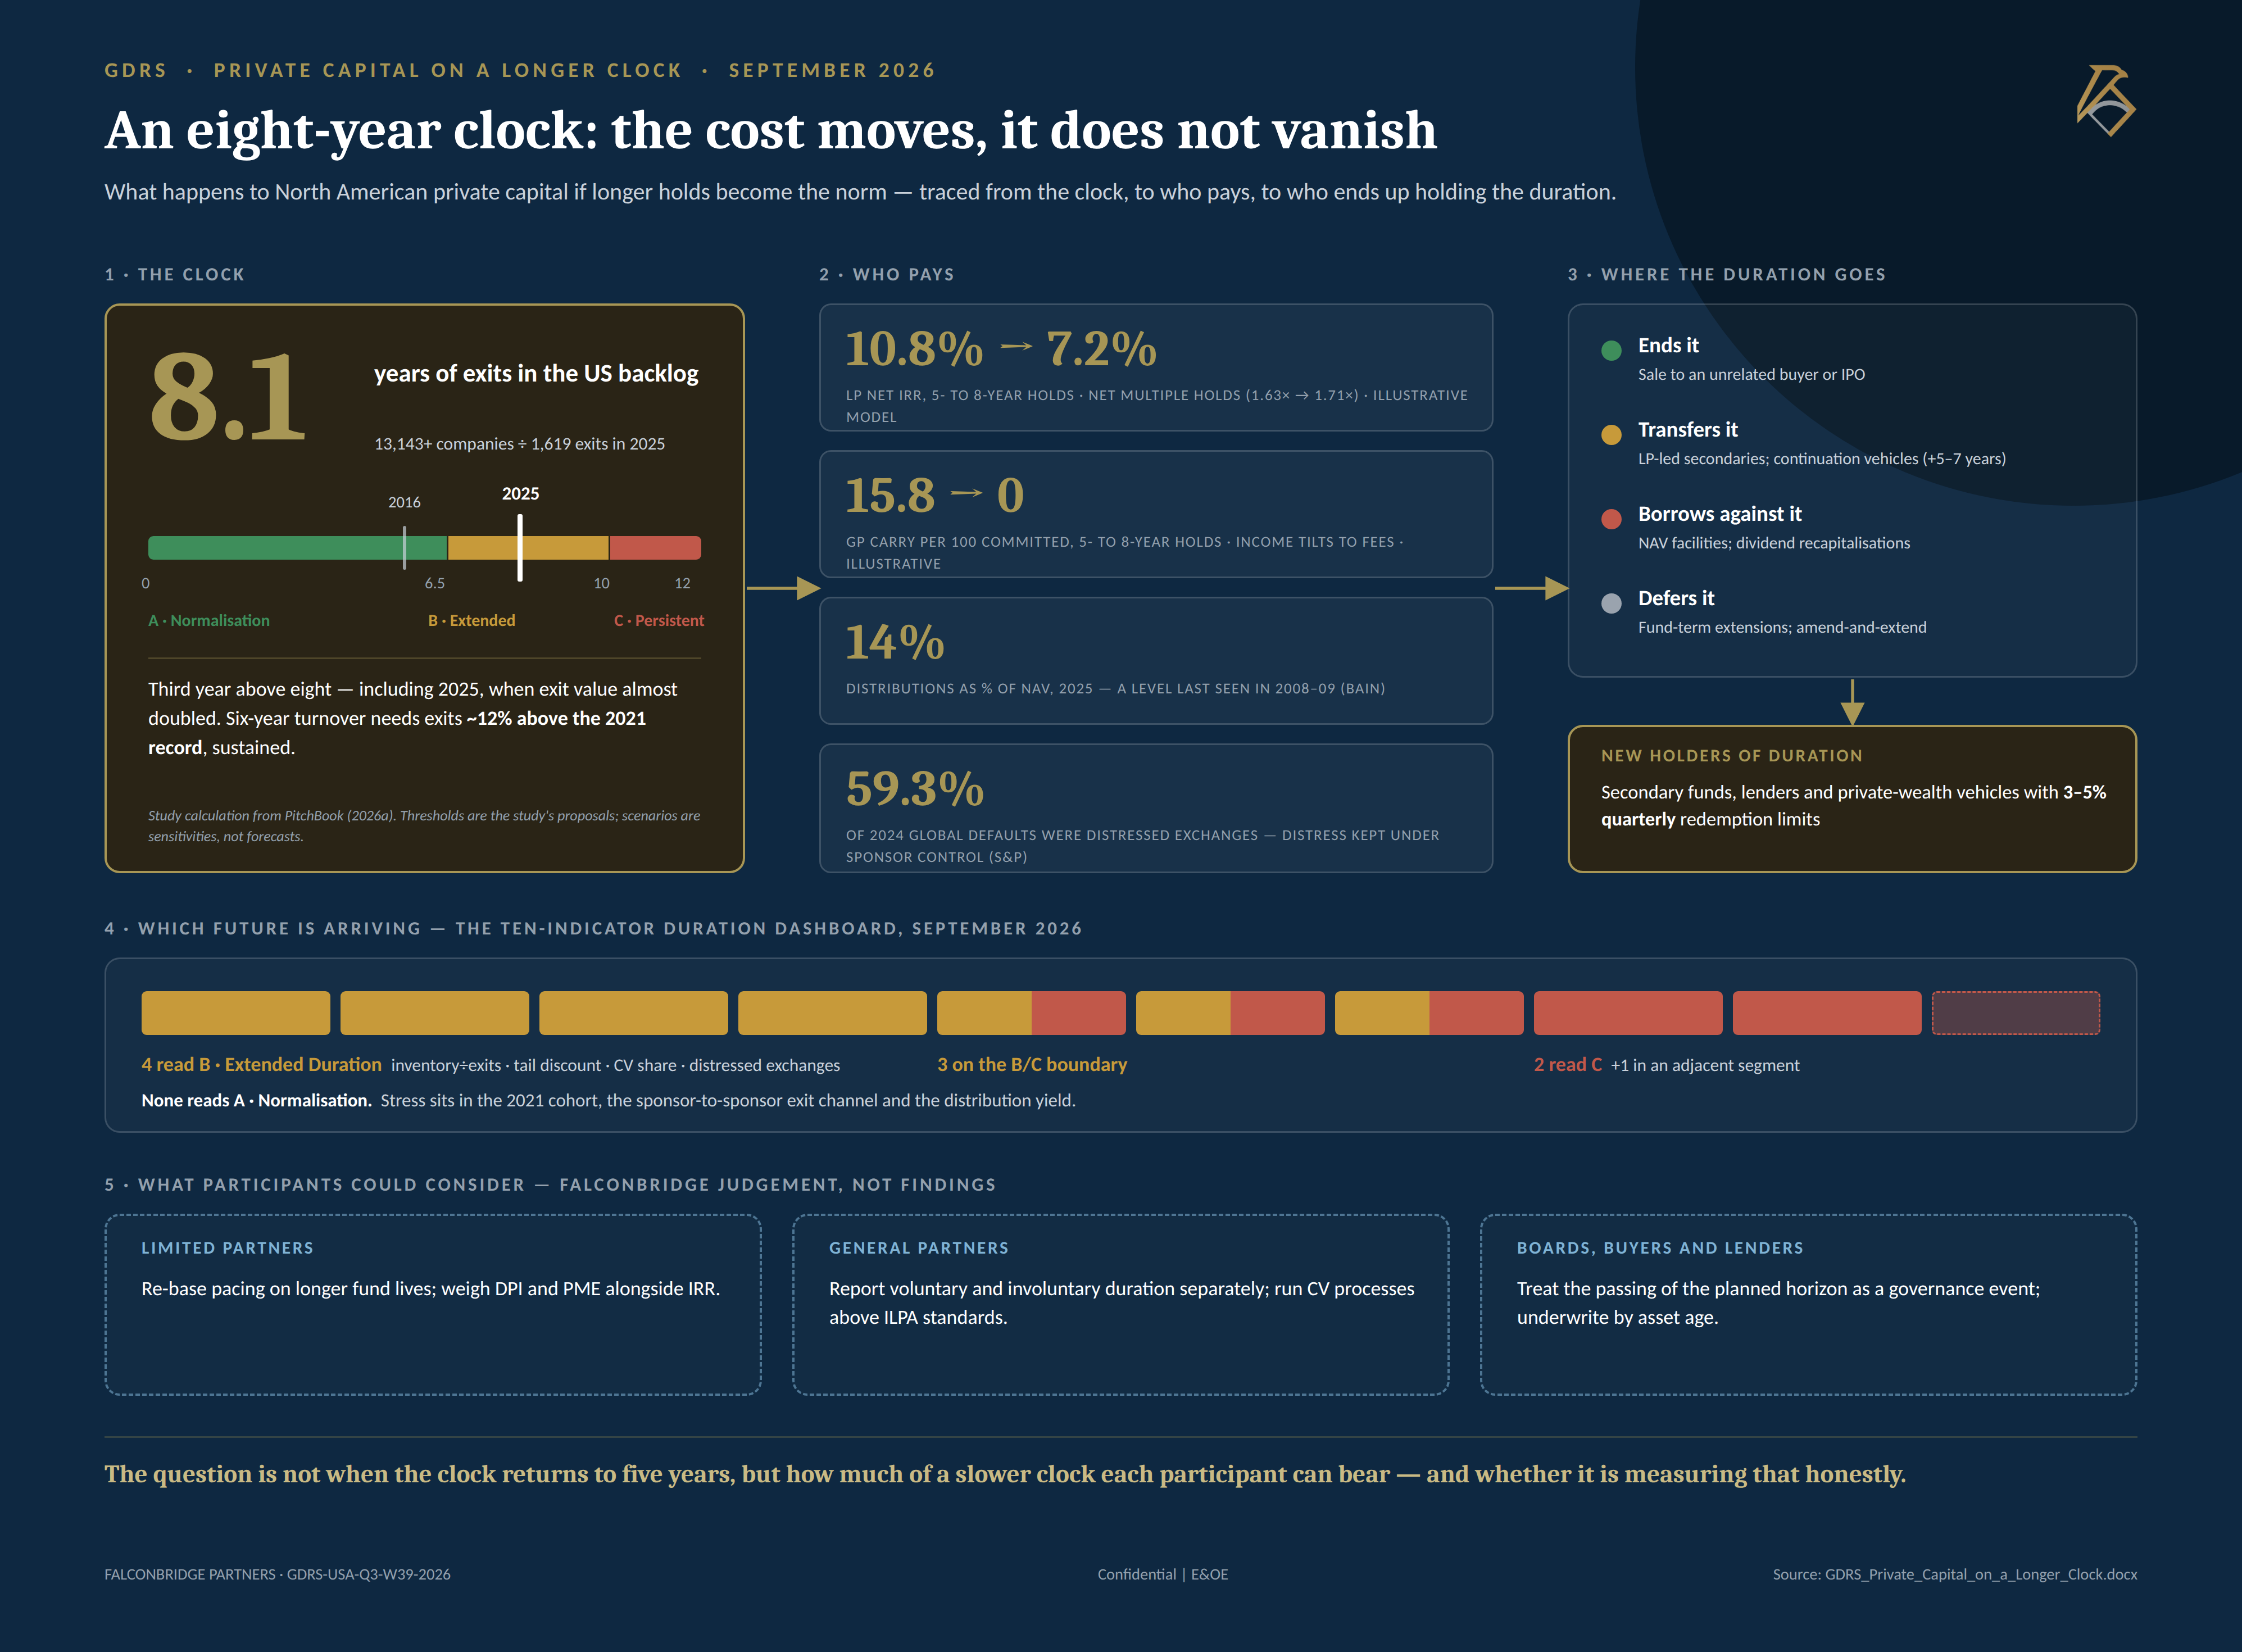
In 2026 financial media reported a record backlog of unsold, sponsor-owned companies. The report asks the question behind the headline: what happens to North American private capital if materially longer holding periods become the norm rather than a phase? On current volumes the United States is already there. Its more than 13,143 PE-backed companies equal a little over eight years of exits at the 2025 pace — the third consecutive year above eight, including a year in which exit value almost doubled. A return to six-year turnover would need exit counts about 12% above the 2021 record, sustained. The widely quoted 33,575 unsold companies cannot be read as a US count: the source gives no geographic qualifier, and the figure matches global totals. Longer holds re-price time; they do not break the model. In the report's illustrative fund model, stretching holds from five to eight years at a constant 2.0× gross multiple cuts limited partners' net IRR from 10.8% to 7.2% and their DPI at year ten from 1.63× to 0.68×, while their net multiple holds because carried interest falls away. The cost relocates. Distributions run at 14% of NAV, a level last seen in 2008–09; manager income tilts from carry to fees; distressed exchanges now account for most defaults. Continuation vehicles, NAV loans and recapitalisations transfer, borrow against or defer duration; only a sale to an unrelated buyer ends it. Longer holds are not only a cost. Where they are voluntary and well financed they can support investment and avoid forced sales; secondary buyers face a structural supply priced by asset age; and long-dated and permanent capital suits the longer clock. Direction is established with confidence; specific values are not. The best econometric evidence attributes most, but not all, of the slowdown to the cycle. Publishers revise their own series between editions, and the report records twenty-two corrections to widely used figures. Its three scenarios are sensitivities, not forecasts. Participants could stop planning for a return to five years and decide how much of a slower clock they can bear: limited partners by re-basing pacing on longer fund lives and weighing DPI and PME alongside IRR; general partners by reporting voluntary and involuntary duration separately; boards by treating the passing of the planned horizon as a governance event. All could track the report's ten-indicator Duration Dashboard, which at September 2026 reads predominantly Extended Duration and nowhere normalisation. Figures above are verified findings or labelled model outputs drawn from the source report. The final paragraph's suggestions are FalconBridge's judgement, offered for the reader's own decision; they are not findings. E&OE. All rights reserved.
Eight years
Its more than 13,143 PE-backed companies equal a little over eight years of exits at the 2025 pace
10.8% to 7.2%
stretching holds from five to eight years at a constant 2.0× gross multiple cuts limited partners' net IRR from 10.8% to 7.2% and their DPI at year ten from 1.63× to 0.68×
14% of NAV
Distributions run at 14% of NAV, a level last seen in 2008–09
The complete package
Six elements, tailored to the question and to how readers will use the work
Tell us who is reading and the pack is emailed to you straight away. The package is released under a Type-1 licence for the requester’s own use. Public access does not transfer ownership.

A conversation about your decision
What needs to be understood
before your next decision?
Bring the proposition, question or direction you are working on. Together, we can define the support it requires.
Start a conversation